
How long after a stock trade does Congress disclose it?
Understand the congressional disclosure deadline, the gap between trading and publication, and what that means when you read a stock-trading headline.
Read the guide →Hedge funds use alternative data to look for clues before earnings and official reports arrive. Some of those clues come from satellites watching the economy at work.
Every investor wants to know how a business is doing before its next earnings report. Financial statements provide the official numbers, but the activity behind them is happening long before those results are published.
That gap is where alternative data comes in. The term describes information investors use beyond the usual financial statements and company announcements to understand what is happening inside a business or across an industry. It can help them estimate sales, spot changes in demand or question the forecasts other investors are relying on.
Satellite imagery offers a particularly revealing example. From above, investors can count cars outside stores, track weather conditions affecting crops and estimate how much oil is sitting in storage. Each observation gives them another clue about the numbers that may appear in a future report.
Walmart’s next earnings report will tell investors how the business performed. But the customers behind those numbers have already been shopping. Their cars have been arriving, filling parking spaces and leaving again, day after day.
Imagine counting those cars throughout a quarter, comparing the same stores with the same period last year. A single busy Saturday tells you very little. A persistent change across many locations gives you something to investigate.
This is an established use of satellite data. Research into hedge funds’ use of retail imagery describes how providers turn images of parking lots at retailers such as Walmart, Target and Costco into information investors can analyze.
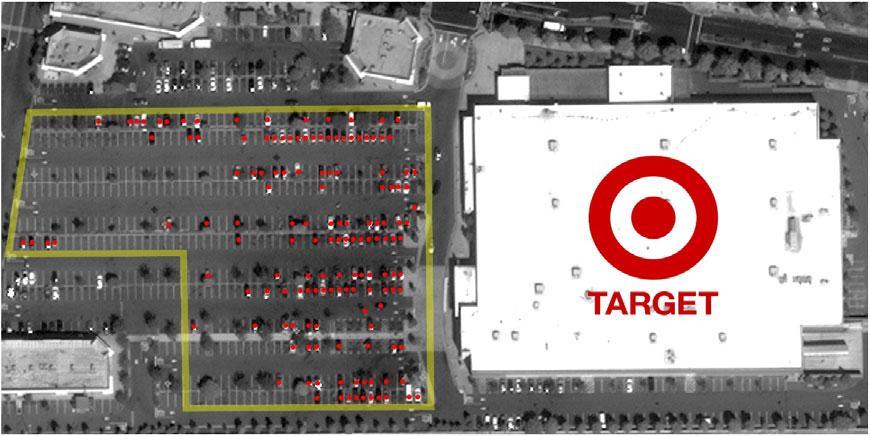
The picture becomes useful when it is repeated. Analysts can measure how full a retailer’s parking lots are and whether that has changed from a year earlier. In a published study of 44 major U.S. retailers, changes in parking-lot utilization helped predict same-store sales, adding information beyond past sales and stock returns.
That gives an investor a way to question the consensus before earnings. If analysts expect weak sales but store traffic is holding up, the business may deserve another look.
Cars still leave important blanks. They do not tell you how much each customer spent, what margin the retailer earned or how online orders performed. The count helps build an estimate; it does not reveal the income statement.
Weather changes how much energy people consume and how much food farmers can grow. Satellite observations help measure what is happening on the ground, while forecasts combine those observations with other measurements and models.
NASA’s Evaporative Stress Index tracks how vegetation is using water. During the 2012 U.S. drought, it showed plant stress in the Corn Belt as early as May, ahead of the full drought that later affected corn and soybean supplies.
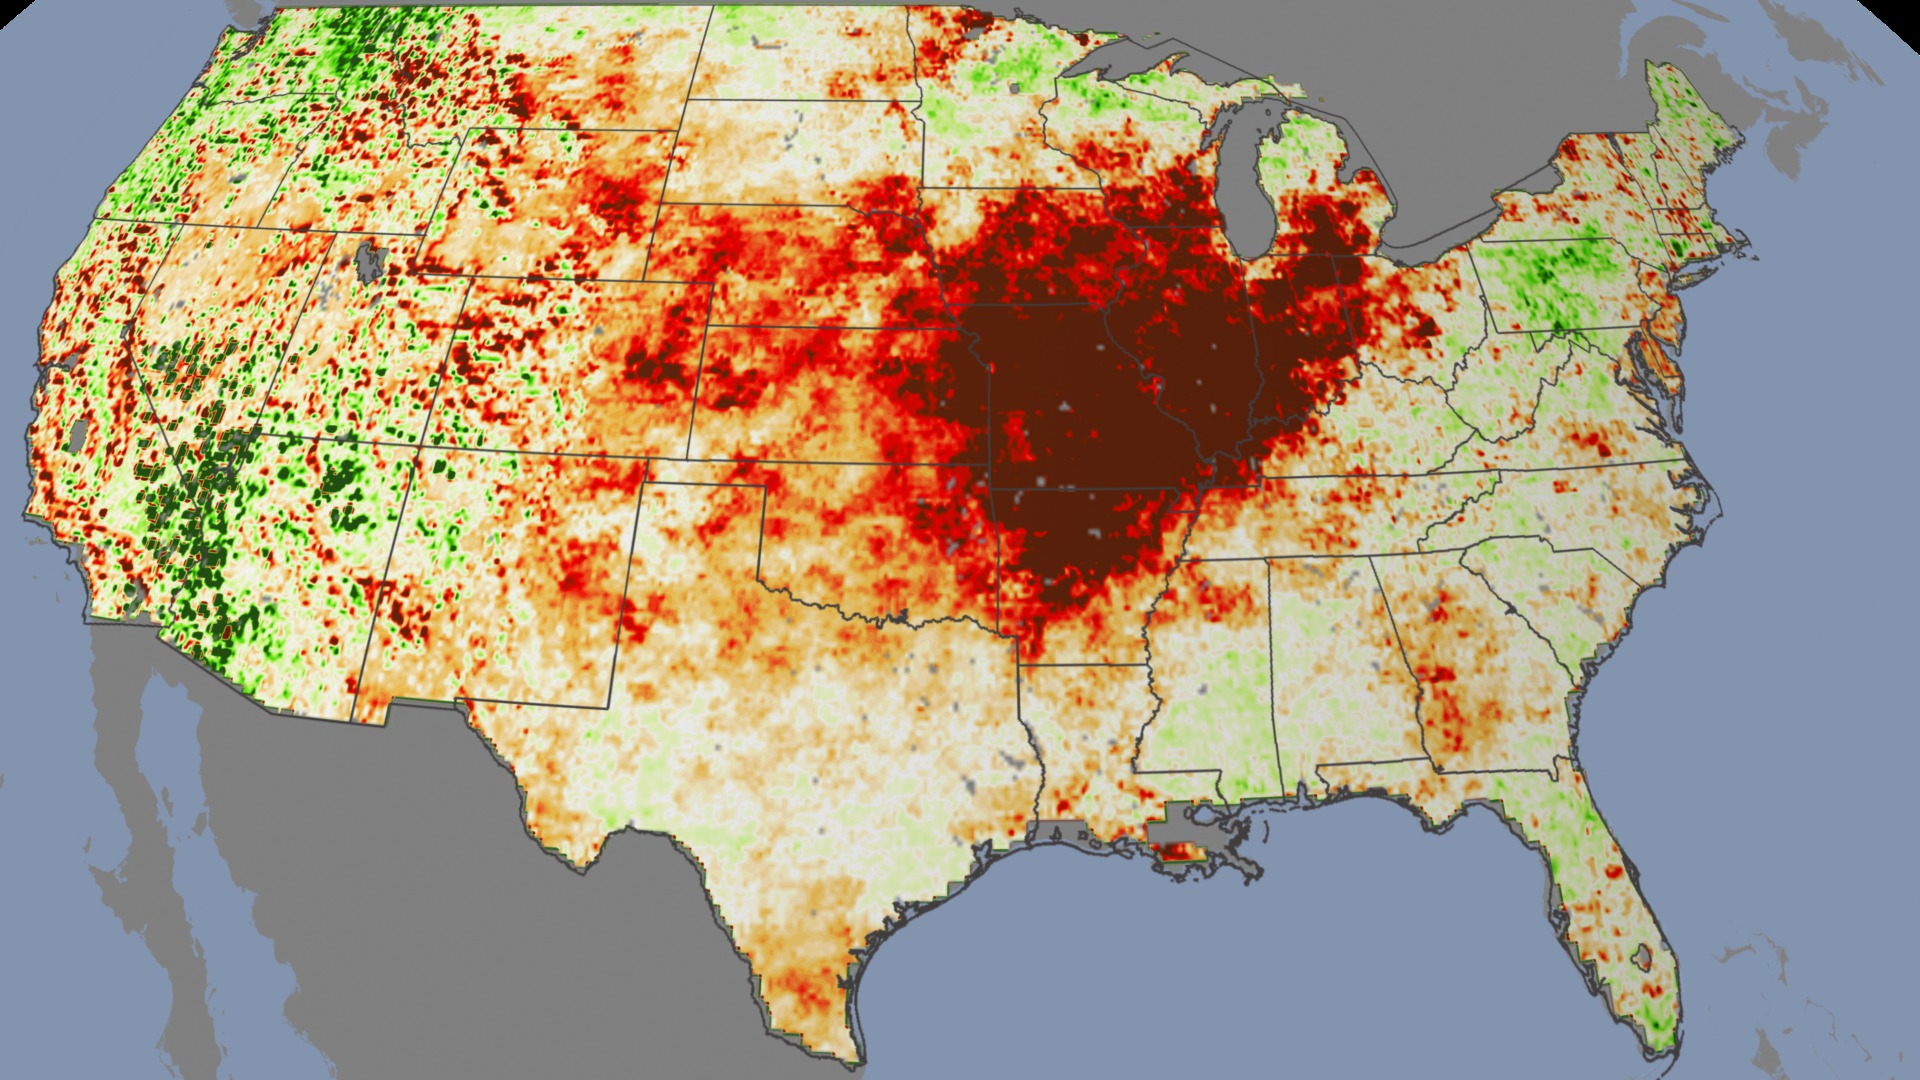
For an investor studying agriculture, deteriorating crop conditions are a reason to revisit assumptions about harvests and supply before the final numbers arrive. The financial consequences can reach beyond the crop itself, into companies that buy it as an ingredient or animal feed.
Energy traders have another weather-sensitive market to watch. The relationship between weather and natural-gas demand is direct: cold raises heating demand, while heat can increase gas consumption at power plants supplying air conditioning.
A forecast turning colder than expected can therefore change a trader’s view of coming demand. The useful question is how much that new forecast changes the picture the market has already priced in.
An oil-storage tank looks like a sealed container. In many tanks, however, the roof floats directly on the liquid. As the tank fills, the roof rises. As oil leaves, it falls.
Measuring the roof’s position provides a way to estimate what is inside.
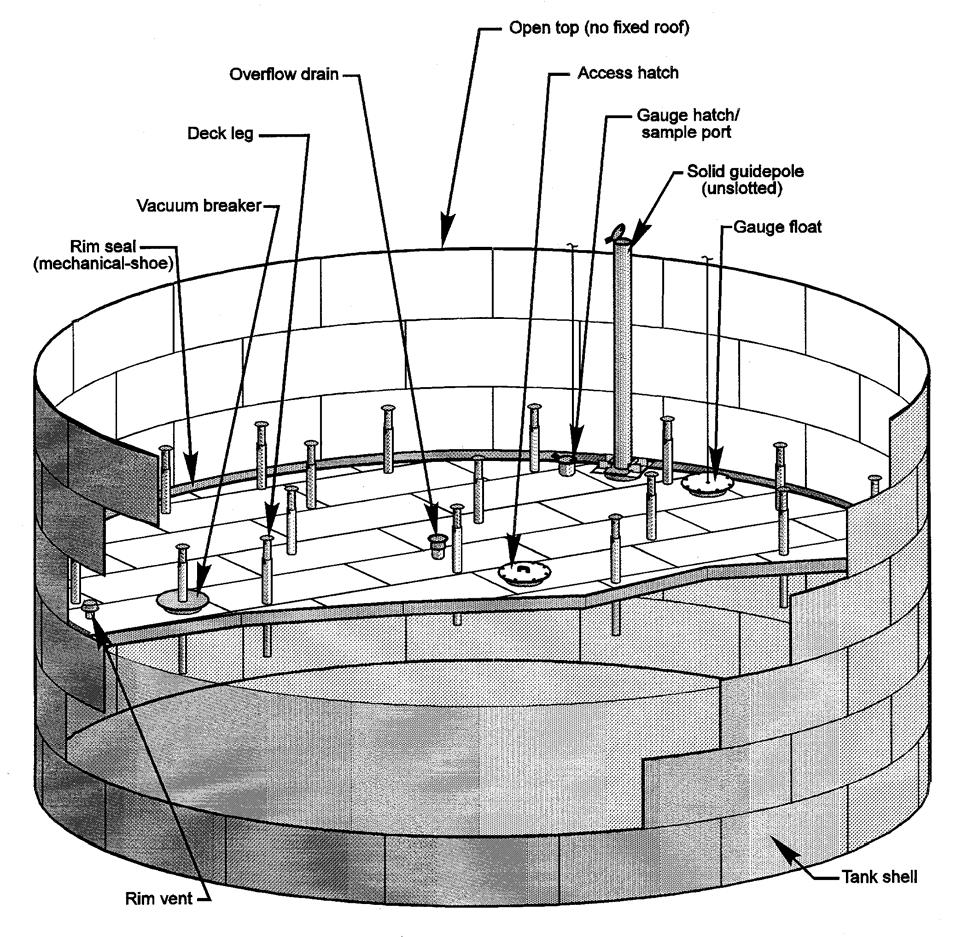
The European Space Agency describes how satellite radar can track floating-roof movements to estimate oil inventories. Radar also works through clouds and at night, helping maintain coverage when ordinary photographs would be less useful.
Data providers turn those observations into inventory estimates for trading desks. Kayrros, for example, markets crude-oil inventory data to traders. Such estimates can help investors form a view before an official inventory release, extending the same approach beyond quarterly earnings.
An unexpected build in storage can prompt questions about demand or excess supply. A drawdown can suggest a tighter balance. Location and expectations matter: oil accumulating at one terminal does not explain the entire global market. And the floating-roof technique cannot simply look inside a fixed-roof or underground tank.
The attraction of alternative data is the chance to observe a business while the quarter is still happening. Making it useful takes comparison: the same stores over time, crop conditions against a normal season, inventories against what traders expected.
For an individual investor, that offers a useful research habit. Ask what observable activity would support a company’s story, and whether the evidence agrees with the expectations built into its share price.
At Capitol Ledger, we apply that curiosity to a different source: public congressional trading disclosures. They show reported purchases and sales, with a delay before investors can see them. Those filings can provide research leads to examine alongside the business and its valuation.
Our newsletter follows what members of Congress are buying and turns those disclosures into stock-research ideas. Paid plans include a model portfolio you can recreate with your own broker, alongside our weekly Friday research articles.
Keep looking beyond the earnings headline with us. Subscribe on Substack for our Friday research, and explore the Capitol Ledger newsletter for Congress-based stock ideas and the model portfolio.
Retail imagery. Zsolt Katona, Marcus O. Painter, Panos N. Patatoukas and Jean Zeng, “On the Capital Market Consequences of Big Data: Evidence from Outer Space,” Journal of Financial and Quantitative Analysis, 60(2), 2025, pp. 551–579. Published study. The final comparable sample covers 44 retailers and 650 firm-quarters during 2011–2017. Results describe historical associations, not a current return forecast. The reproduced Figure 2 depicts Target, not Walmart. Berkeley Haas reporting discusses an earlier version and the commercial use of these datasets.
Weather. NASA SVS, “Drought 2010–2012”, released December 5, 2012. ESI combines satellite observations and meteorological information; the image is dated August 18, 2012. Data credit: USDA-ARS Hydrology and Remote Sensing Laboratory (M. C. Anderson) and NOAA-NESDIS (C. R. Hain and X. Zhan). U.S. EIA, factors affecting natural-gas prices, explains heating, cooling and weather-related supply effects. The crop and gas examples explain economic mechanisms; they are not measured investment returns.
Oil. ESA/Copernicus, September 14, 2018, explains radar measurement of floating roofs. Kayrros’ current product page describes inventory estimates offered to traders; provider claims are not an independent performance test. Inventory observations have coverage and timing limits, and a tank-level estimate is not a forecast of an oil company’s earnings. The EPA tank illustration is reproduced unchanged.
Sources accessed November 13, 2026. Images illustrate the methods and historical observations; none is presented as a live signal.
Understand the congressional disclosure deadline, the gap between trading and publication, and what that means when you read a stock-trading headline.
Read the guide →A worked example shows why transaction dates and public availability produce different backtests, plus the assumptions to check before trusting a chart.
Read the guide →A worked portfolio example explains target weights, existing holdings, new contributions, and why a monthly model update is useful beyond a stock list.
Read the guide →A 30% gain in two months gets attention. A purchase reported by a lawmaker who helps oversee the company’s market gives investors another reason to look closer.
Read the guide →The vote is over. Stocks just plunged. Yet after each of the last 13 midterms, the S&P 500 was higher six months later. The average gain: 12.4%, excluding dividends. This week started the next test.
Read the guide →Educational research based on delayed public disclosures. Model allocations are not personalized investment advice. Hypothetical performance does not establish future returns.