How long after a stock trade does Congress disclose it?
Understand the congressional disclosure deadline, the gap between trading and publication, and what that means when you read a stock-trading headline.
Read the guide →The vote is over. Stocks just plunged. Yet after each of the last 13 midterms, the S&P 500 was higher six months later. The average gain: 12.4%, excluding dividends. This week started the next test.
The vote is over. Stocks just plunged. Yet after each of the last 13 midterms, the S&P 500 was higher six months later. The average gain: 12.4%, excluding dividends. This week started the next test.
Democrats won control of both the House and Senate in Tuesday’s U.S. midterm elections. The Associated Press called the Senate on election night and the House early Wednesday morning. With Donald Trump still in the White House, the result sets up divided government when the new Congress takes office.
Markets initially rallied. Then Thursday delivered a mini crash: the S&P 500 fell 4.4%, the Nasdaq Composite dropped 5.5%, and the Dow lost 3.4%. The selloff erased Wednesday’s gains. AI and data-center stocks led the retreat as investors worried that the election outcome could slow the building boom behind them.
A result one day, a rally the next, then a sudden plunge. It is easy to see why investors wonder whether they should get out until the dust settles.
But the six-month record gives them a reason to look further ahead. Across all 13 midterms from 1974 through 2022, the S&P 500 finished higher six months after the election. Every time. The average price gain was 12.4%.
That record spans different election outcomes. You did not need to pick the winning party for the pattern to appear. The question now is how markets develop between this week’s vote and May 2027.
The record concerns where the market finished six months later. It leaves room for painful days along the way—including a week like this one. Thursday’s fall is real; it is also much too early to judge a pattern measured over half a year.
For this cycle, the clock started with the November 3 election. The corresponding six-month checkpoint falls in May 2027. History gives us a reason to follow that window closely, although it cannot guarantee the next result.
The gains have spread well beyond one corner of the market. We calculated six-month returns for 12 U.S. industry portfolios after the same 13 midterms, from 1974 through 2022. Technology and equipment led with an average gain of 21.7%, followed by retail and services at 16.9% and manufacturing at 16.0%.
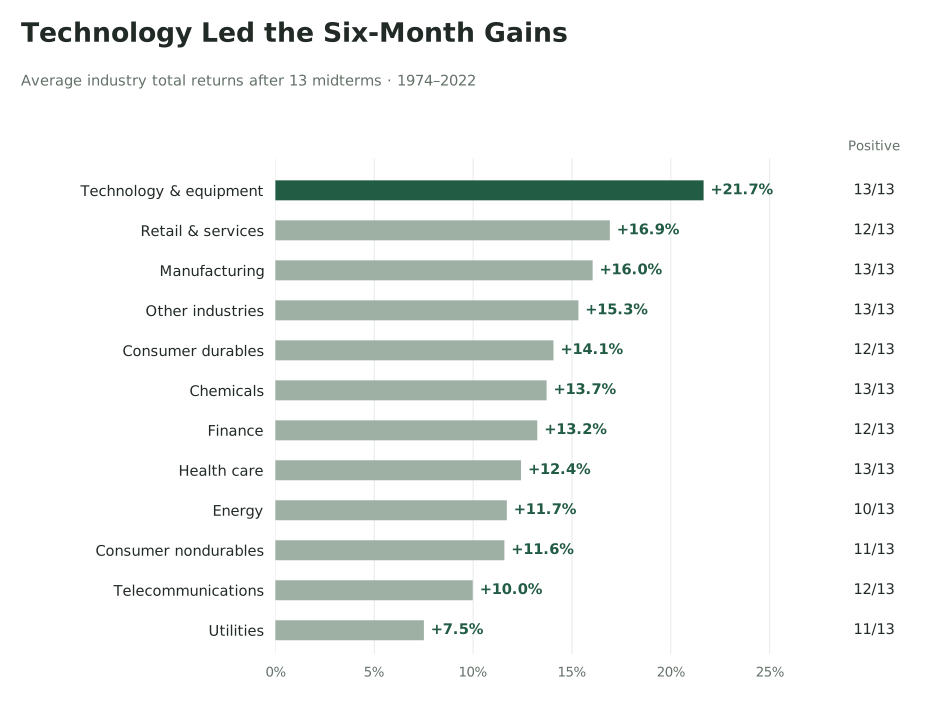
Our industry comparison shows that technology and equipment, manufacturing, chemicals and health care all finished higher in every one of those six-month periods. Energy rose in 10 of 13; utilities in 11. The market-wide pattern was strong, but the industry you chose affected both the size and consistency of the gains.
October already has a reputation for volatility. Cboe has described it as historically the most volatile month for the S&P 500, with the crashes of 1987 and 2008 skewing the record. Election campaigns add another layer of uncertainty about taxes, spending and regulation.
Once the result is known, investors can start working with a clearer picture of what Washington can pass and what it is likely to block. They may dislike the outcome and still find it easier to value a business under a known political arrangement.
The St. Louis Fed’s Christopher Neely found that expected stock-market volatility usually declined after elections. In his analysis, the VIX fell by an average of 7.3% around midterms, measured from two days before the vote to three days afterward.
This week shows how quickly a new concern can take over. The election result clarified who will control Congress; it also raised fresh questions about AI spending. A calmer political outlook and a volatile stock market can coexist while investors work through those consequences.
BlackRock examined the same six-month holding period across midterms since 1970. The S&P 500’s average total return was positive both when a party lost unified control of Washington and under the other midterm outcomes it studied.
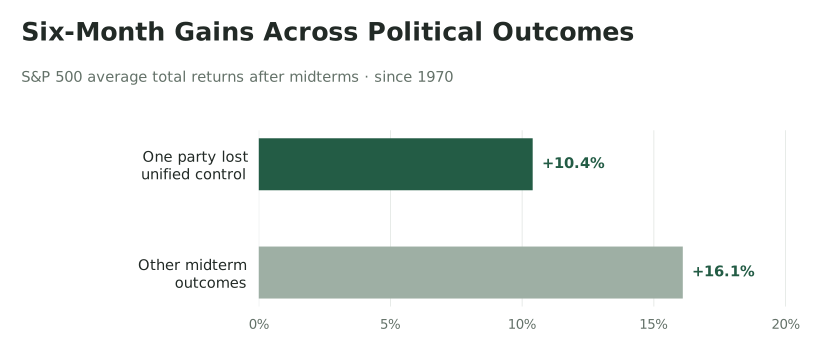
The size of the gains differed, but both groups rose on average. That supports a more useful approach than treating an election win by your preferred party as a condition for investing.
The historical rally also often began before the vote: the average advance started roughly a month ahead of Election Day. Waiting until every headline feels reassuring can mean missing part of the move.
The simplest way to participate in a broad-market recovery is through broad-market exposure, such as a low-cost S&P 500 fund. You do not have to guess which single company will benefit most from the election. If you already invest regularly, this history is a reason to think carefully before abandoning that plan over a frightening week.
For readers looking for individual stocks, the selloff creates a research list. Which businesses now trade at lower prices while their sales outlook remains intact? Which companies could benefit as the new Congress sets its priorities? Start there, and follow what happens over the coming months.
This week’s election and selloff are exactly the kind of events we follow at Capitol Ledger: what changed, how markets reacted, and where investors might find ideas worth researching.
Our Friday articles connect major events with the markets and companies they affect. Our newsletter brings you research ideas from what members of Congress are buying; paid plans include a model portfolio you can recreate and follow with your own broker. We put the purchases in context, including the delay before trades become public, so readers can decide what deserves a closer look.
Keep following this six-month window with us. Subscribe on Substack for our Friday research, and explore the Capitol Ledger newsletter for Congress-based stock ideas and the model portfolio.
Associated Press — Calling control of Congress in the 2026 midterm elections. Senate and House control calls, November 3–4, 2026.
Joe Mazzola, Charles Schwab — Stocks Plunge on AI Fears, Volatility Erupts. November 5, 2026 closing report. Index losses rounded to one decimal place.
Michael Townsend, Charles Schwab — What the 2026 Midterms Could Mean for the Markets. S&P 500 price returns after 13 midterms, 1974–2022; six-month average 12.4%, all 13 positive. Yahoo Finance data through August 14, 2026.
Kenneth R. French Data Library — 12 Industry Portfolios; daily return data. Capitol Ledger calculations use value-weighted daily total returns, September 2026 data vintage, for the same 13 elections. Compound returns from the day after Election Day through the first trading day on or after six calendar months later; average each election equally. Industry groups use historical SIC classifications. Technology and equipment covers computers, software and electronics; retail and services includes wholesale. Daily calculation inputs.
Cboe — Inside Volatility Trading: A Day, A Week, A Year, A Decade. Historical discussion of October volatility.
Christopher J. Neely, St. Louis Fed — What Happens to Expected Stock Volatility around Election Day? December 2, 2024. VIX percentage changes around elections; the 7.3% decline is a volatility-index change, not a stock return.
Benjamin Cantrell and Mark Peterson, BlackRock — What history says about 2026 midterm elections and market performance. October 1, 2026. S&P 500 total returns over approximately six months after 14 midterms, 1970–2022, using Bloomberg data as of August 13. Price returns exclude dividends; total returns include them.
Understand the congressional disclosure deadline, the gap between trading and publication, and what that means when you read a stock-trading headline.
Read the guide →A worked example shows why transaction dates and public availability produce different backtests, plus the assumptions to check before trusting a chart.
Read the guide →A worked portfolio example explains target weights, existing holdings, new contributions, and why a monthly model update is useful beyond a stock list.
Read the guide →A 30% gain in two months gets attention. A purchase reported by a lawmaker who helps oversee the company’s market gives investors another reason to look closer.
Read the guide →Hedge funds use alternative data to look for clues before earnings and official reports arrive. Some of those clues come from satellites watching the economy at work.
Read the guide →Educational research based on delayed public disclosures. Model allocations are not personalized investment advice. Hypothetical performance does not establish future returns.